Data Analytics & Visualization
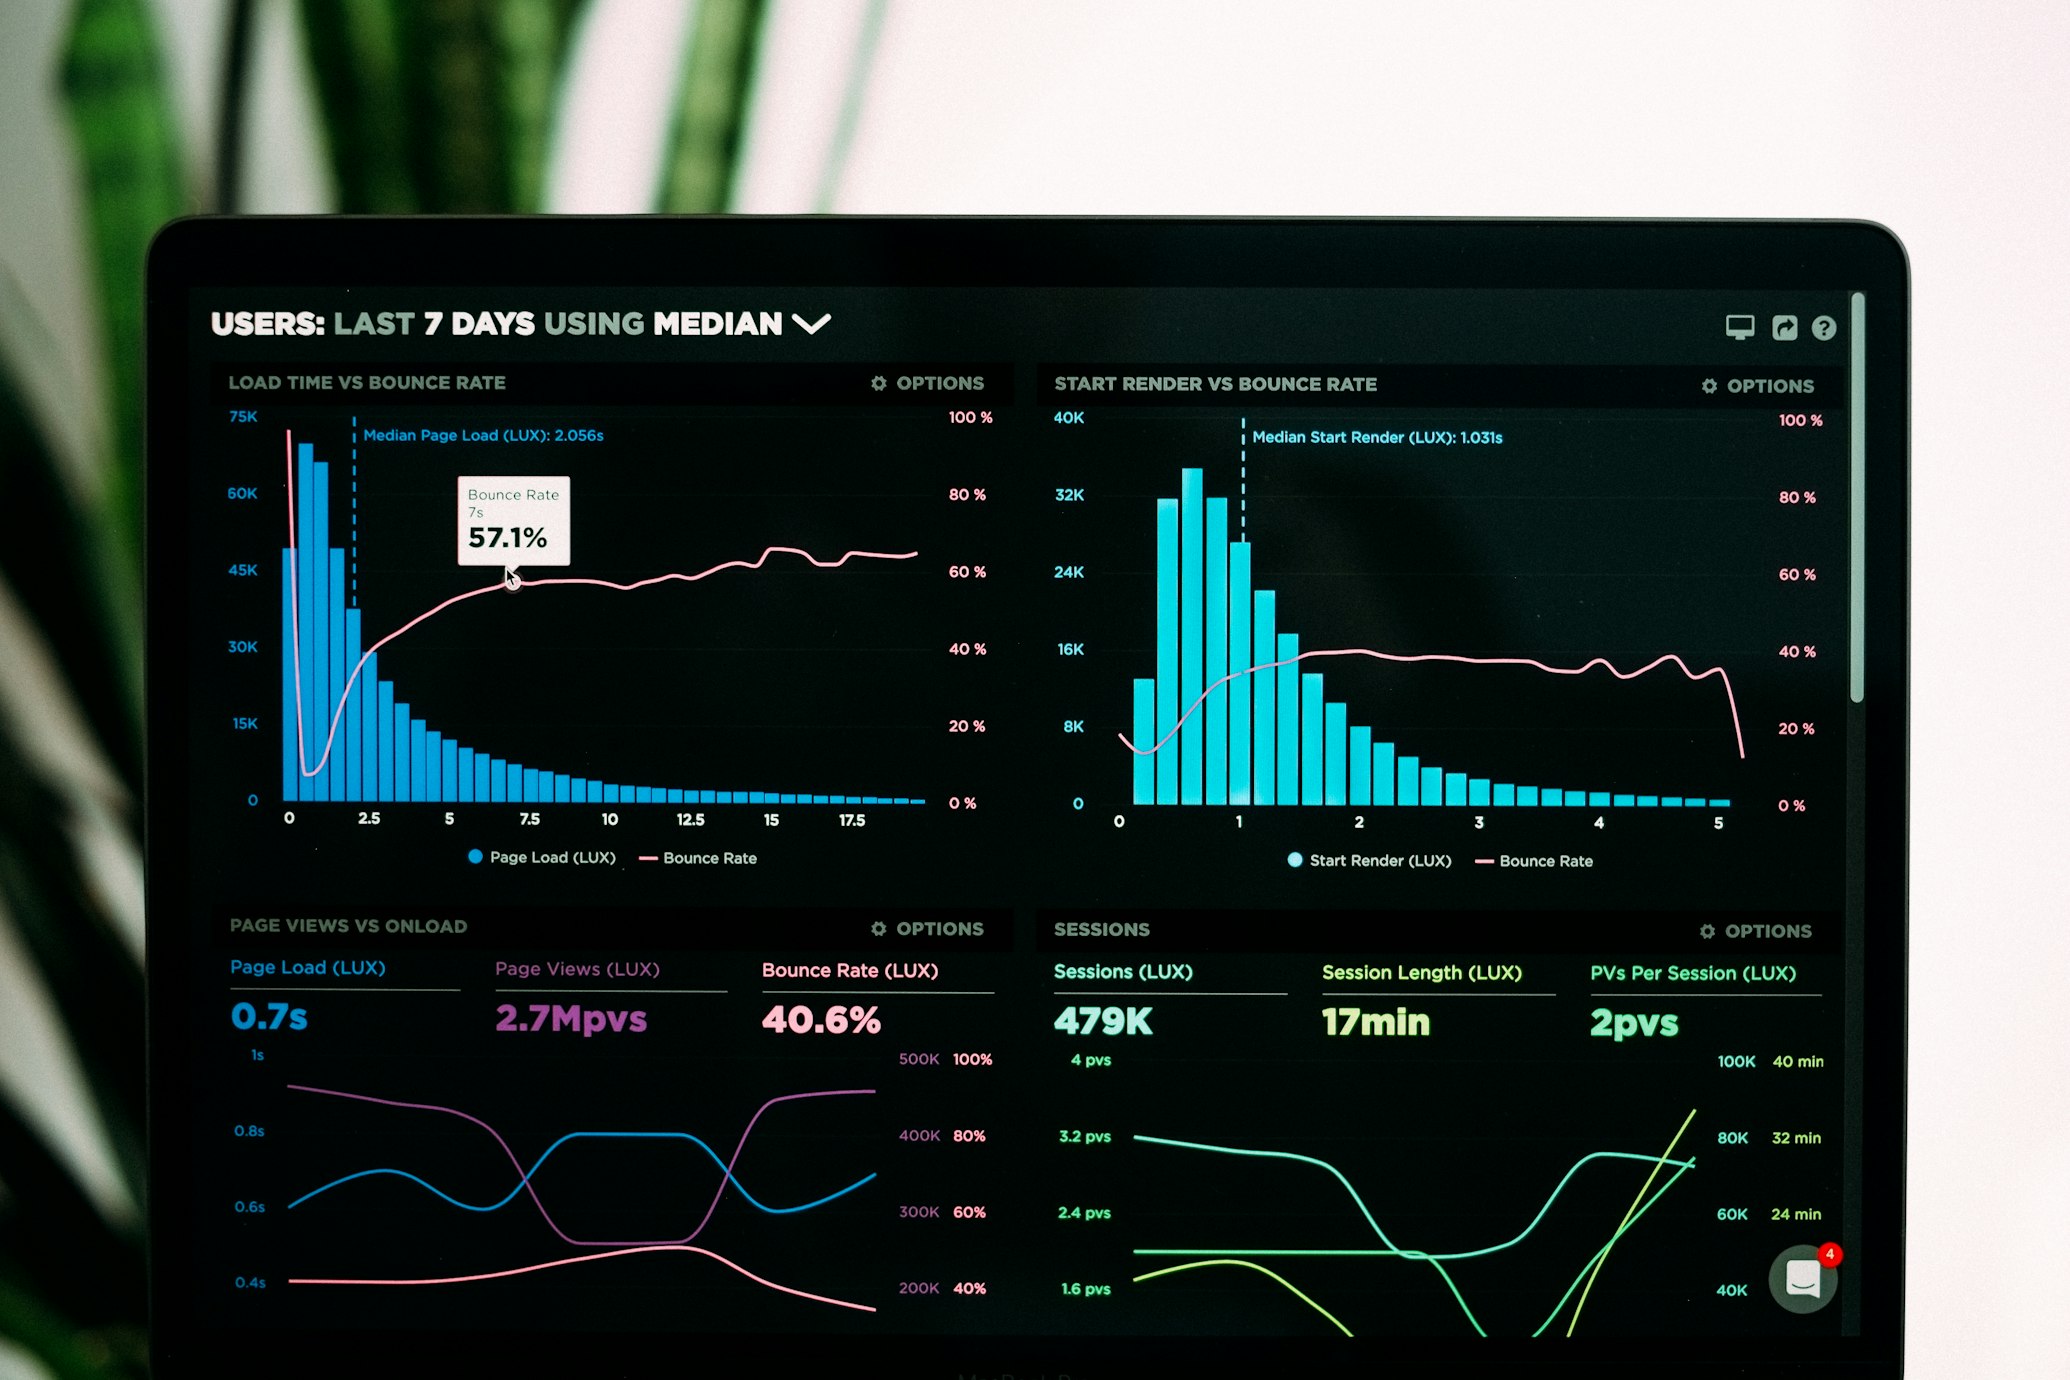
Unlock the power of your data with advanced Python analytics and visualization solutions. From data processing to interactive dashboards, we help you make informed decisions with clear, actionable insights.
Data Analytics Excellence
Insights That Drive Business Success
Why Choose Our Analytics Services
We deliver clear insights that transform data into competitive advantage
Data Analytics Services
From data processing to interactive dashboards, we provide comprehensive analytics solutions
Data Processing & Cleaning
Statistical Analysis
Data Visualization
Interactive Dashboards
Business Intelligence
Data Quality & Validation
Benefits of Data Analytics
Data analytics delivers insights that drive better decisions and business growth
Data-Driven Decisions
Make informed decisions based on real data insights and trends
Performance Insights
Track KPIs and performance metrics with real-time analytics
Competitive Advantage
Gain market insights and identify opportunities before competitors
Automated Reporting
Generate automated reports and dashboards for continuous monitoring
Frequently Asked Questions
Get answers to common questions about our data analytics services
What Python libraries do you use for data analytics?
We use industry-standard Python libraries including pandas for data manipulation, NumPy for numerical computing, Matplotlib and Seaborn for visualization, Plotly for interactive charts, and scikit-learn for statistical analysis. We also work with Jupyter notebooks for exploratory analysis.
Can you work with different data formats and sources?
Yes! We work with various data formats including CSV, Excel, JSON, XML, databases (SQL, NoSQL), APIs, and cloud storage. We can integrate with your existing data sources and help you set up automated data pipelines for continuous analysis.
Do you provide interactive dashboards and reporting?
Absolutely! We create interactive dashboards using tools like Plotly Dash, Streamlit, and custom web applications. Our dashboards provide real-time updates, filtering capabilities, and drill-down functionality for comprehensive data exploration.
How do you ensure data accuracy and quality?
We implement comprehensive data validation, quality checks, and cleansing processes. This includes duplicate detection, missing value handling, outlier identification, and data consistency verification to ensure reliable analytics results.
Can you help with real-time data analytics?
Yes! We develop real-time analytics solutions using streaming data processing frameworks. We can set up live dashboards, automated alerts, and continuous monitoring systems that update as new data arrives.
What is the typical timeline for analytics projects?
Project timelines vary based on complexity. Simple data analysis projects take 1-2 weeks, while comprehensive analytics solutions with dashboards may take 4-8 weeks. We provide detailed timelines during our initial consultation based on your specific requirements.
Ready to Transform Your Data into Insights?
Unlock the power of your data with our expert analytics services. Get started with a free consultation and discover how data analytics can drive your business success.